


The crypto industry is fast-moving, disruptive, and rapidly changing. Within a month, markets can rally by double-digits, a novel blockchain can gain dominance, or a new DeFi platform can revolutionize the industry. We are launching the first edition of the SwissBorg Monthly Update to keep our community posted on everything in the crypto space.
We will introduce the newsletter by looking at dominant trends that the industry experienced in April of 2022 and a macro trend analysis of Bitcoin.
Dominant April 2022 Trends
Multi-faceted Uncertainty
Q1 of 2022 showed a highly uncertain state of global markets relating to cryptocurrencies and general asset classes. Closing out April, this uncertainty has not faded but instead seems to be compounding due to numerous forces:
- The Russia-Ukraine war is still ongoing with no apparent signs of stopping anytime soon.
- Recurring inflation and recession fears.
- Concerns related to new COVID-19 outbreaks and lockdowns in China.
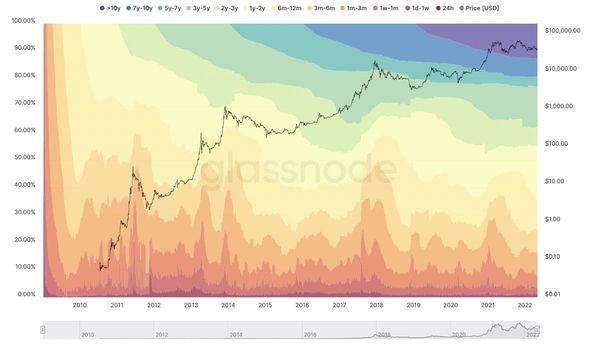
The uncertainty in the market is reflected by the Fear & Greed index, which ranged between 20 and 30 for the last month, namely extreme fear. Although April has historically been a bad month for the blockchain market, high percentages of long-term holders (seen in the HODL Waves chart shown below) show the faith investors have in the crypto market.

Steps Towards Mass Adoption
Despite downwards price action, the adoption of cryptocurrencies is happening, and April brought significant developments:
- Central African Republic became the second country to adopt Bitcoin as a legal tender.
- Panama passed a bill to regulate the use of cryptocurrencies as a payment method, along with no capital gains tax on Bitcoin investments.
- Fidelity Investments announced that it would allow clients to invest in Bitcoin from their 401K retirement accounts.
- Central Bank Digital Currencies (CBDCs) pilot programs are rising rapidly in Europe, the Philippines, and China.
Ethereum’s TVL Dominance Continues to Decrease
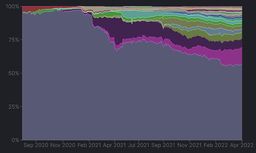
Although Ethereum maintains a large portion of Total-Value-Locked (TVL) dominance with over 57%, other blockchains have channeled Ethereum’s weaknesses, such as transaction fees and scalability, to grow user retention. The progressive rise of competitor blockchains in Q1 2022, such as Avalanche, Solana, and Luna, followed a stabilization phase in April, with very little TVL volatility. As shown in the chart to the right, Luna has continued its rise, outperforming competitor blockchains in DeFi TVL growth (Luna pink, Binance Smart Chain purple, Avalanche green, Solana brown, Fantom light blue). Currently, Luna makes up over 13% of TVL across blockchains.

The Merge Delay
Ethereum's "The Merge", the blockchain's transition from proof-of-work (PoW) to proof-of-stake (PoS), has been once again postponed to Q3 of 2022. This year, the anticipation had supported Ether even as inflation and monetary tightening shackled Bitcoin. This narrative will continue to impact the cryptocurrency's price action significantly, and further delays in the delivery of blockchain upgrades could crush market sentiment.
Considering that the implementation of PoS and sharding, which will bring scalability, efficiency, and cheaper transaction fees to the network, will not come for another year, Alt Layer 1's will still have time to continue capturing TVL.
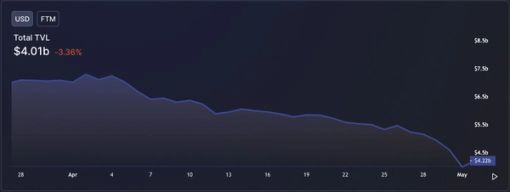
Fantom Takes a Hit
Nearly every non-stable coin among the top-100 cryptocurrencies has seen substantial sell-offs, but Fantom has been one of the biggest losers across the stretch, down ~80% from its all-time highs.
Andre Cronje, the renowned lead DeFi builder, suddenly exited crypto in mid-March, severely affecting the community and the Fantom ecosystem. $FTM’s price progressively crashed soon after, and projects in the Fantom ecosystem saw their price crash, too, with users consistently leaving protocols following the news. The downward trend in network activity and outflows from the blockchain continued in April, with a further loss of 30% TVL.

On April 28th, news emerged that a hacker exploited roughly $13.4 million from the Deus Finance Platform through a more sophisticated variation of a "flash loan attack". This is the second exploit after a ‘smaller’ $3 million hack that the protocol suffered in mid-March, also prompting security concerns about the network.
Nonetheless, Fantom remains one of the most attractive blockchains in the DeFi space and is comparatively undervalued in terms of Marketcap/TVL. It will be interesting to see how it recovers and how it will manage to compete against the rising relevance of Luna, Avalanche, and Solana.
All eyes on Near
Near, the Layer 1 PoS blockchain that achieves scalability through sharding and has fast and cheap transactions, saw its TVL double while the rest of the blockchains lost 15% - 45% of their TVL in April. They have raised $500 million since the start of 2022 and have an $800 million ecosystem fund to incentivize developers to build on the network through grants. Funding attracts developers, which then build apps that attract users, and this flywheel continues to increase the growth of the network.
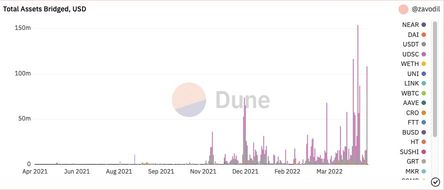
Rainbow Bridge, a trustless bridge between Near, Ethereum, and Aurora (EVM compatible Layer 2 built on top of Near Protocol), saw spikes in USD inflows to the Near and Aurora chains, with over $2 billion worth of assets bridged to date.

Considering the bearish environment, Near and Aurora’s metrics show strong growth in adoption regarding the number of transactions, active contracts, and live accounts. The protocols within these ecosystems to keep an eye out for are Aurigami, Bastion, Trisolaris and Ref Finance (introducing multichain liquidity between Near and Aurora).
The Emergence of More Decentralized Stablecoins
The success of Terra's UST has led to the emergence of new native stable coins on the Near and Tron blockchains. Stablecoins in the industry need to be just as decentralized as Bitcoin so no one can interfere with them as regulatory pressure will at some point hit both centralized and decentralized stablecoin protocols. Tron's USDD and Near's USN stablecoins will be not backed by physical dollars but instead utilize algorithms to balance supply and demand by incentivizing traders to keep the coin's price stable, similarly to Terra's UST stablecoin.
Anchor Protocol's 19.5% annual percentage yield (APY) interest on Terra's UST played a significant part in attracting users to the Terra network, although it may be lowering its rates soon. Tron will offer 30% interest on its USDD at launch on May 5th, 2022.
There is no certainty as to how long these interest rates will last, but this should be a major catalyst for the Tron ecosystem, at least in the short term. Beyond the attractive APYs, the grander purpose continues to be to replace centralized currencies with the new paradigm of decentralized money.
The Move-and-Earn Boom
The latest trend in the crypto space has been Move-to-Earn (M2E) apps, through which users can earn money while doing regular physical activities. The M2E gamification is similar to play-to-earn in that players control all of their in-game assets, which can be traded for crypto or fiat currencies. The concept of rewarding or tokenizing physical movements was pioneered by STEPN (GMT) and has since been adopted by various games such as Dotmoovs (MOOV) and Genopets (GENE). Early-stage projects like Sweatcoin and Walken, the former of which already has an enormous amount of downloads before releasing their token later this year, are some to watch for as this trend will undoubtedly persist in the near and potentially long-term future.
Passive income through physical activity will keep attracting users who seek to enter the world of blockchain technology and contribute to the industry while monetizing their movement.
BTC Analysis
Bitcoin’s price remains at range-bound levels, where it has been since the start of 2022. Despite the macro downtrend from its $69,000 peak in November of 2021 (orange), Bitcoin has recorded higher highs and higher lows from the bottom in January 2022 (blue).

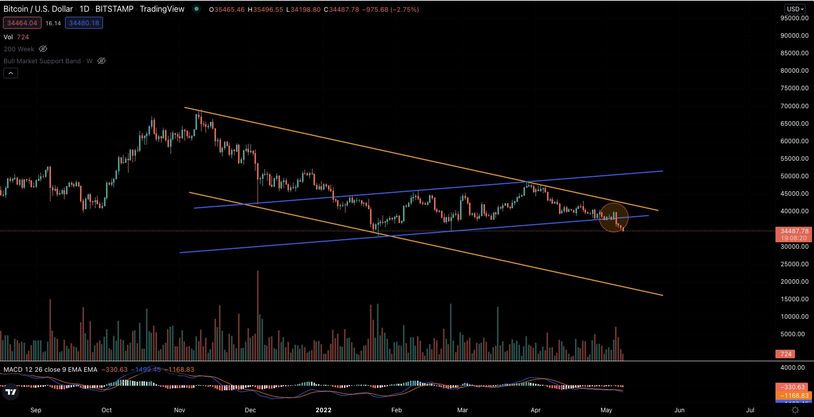
Although correlations between Bitcoin and traditional markets remain near all-time highs, Bitcoin has remained surprisingly robust relative to the S&P 500 and NASDAQ indexes that traded to new local lows on the last days of April.
Many Bitcoin buyers of the last months are holding positions at unrealized losses. On-chain data shows around 82% of the Bitcoin Short-Term Holder Supply (BTC supply held for less than 155 days) is currently in a loss. Investors holding this supply are the likeliest to sell their coins off during market volatility creating a potential for a capitulation event.
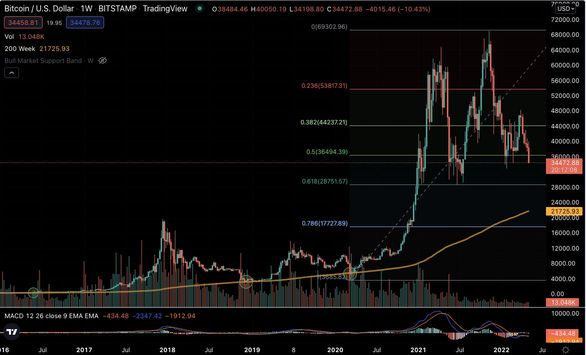
After bull-run peaks, Bitcoin has experienced steep corrections to the 0.78 and 0.88 Fibonacci retracement levels before starting another long-term uptrend. This means that the current retracement at the 0.5 levels (~$36,000) leaves room on the downside for much steeper corrections, especially to the 0.61 levels (~$29,000). Another indicator on the weekly chart that has been a long-tested bear market bottom indicator for Bitcoin is the 200-week simple moving average (orange line). Bear market bottoms in 2016, 2018, and 2020 used this line as support before starting another bullish market cycle. Again, this line sitting at the ~$21,700 levels shows room for further downside in the medium-long term.

Invest using the SwissBorg app today!