


At SwissBorg, in addition to our efforts to provide you with an optimal investment application, we are committed to offering integrated tools to help you with your decision making.
We have developed an automatic Intelligent analysis that is updated hourly for all the tokens available in the SwissBorg app. Our automated analysis uses artificial intelligence (AI) to assist you, systematically, with forecasting Bitcoin and other cryptocurrencies.
Every hour, you can find the updated analysis of your favourite crypto in the Learn section of each token available in the app.
The current analysis is based on the price in USD and is composed of the following information:

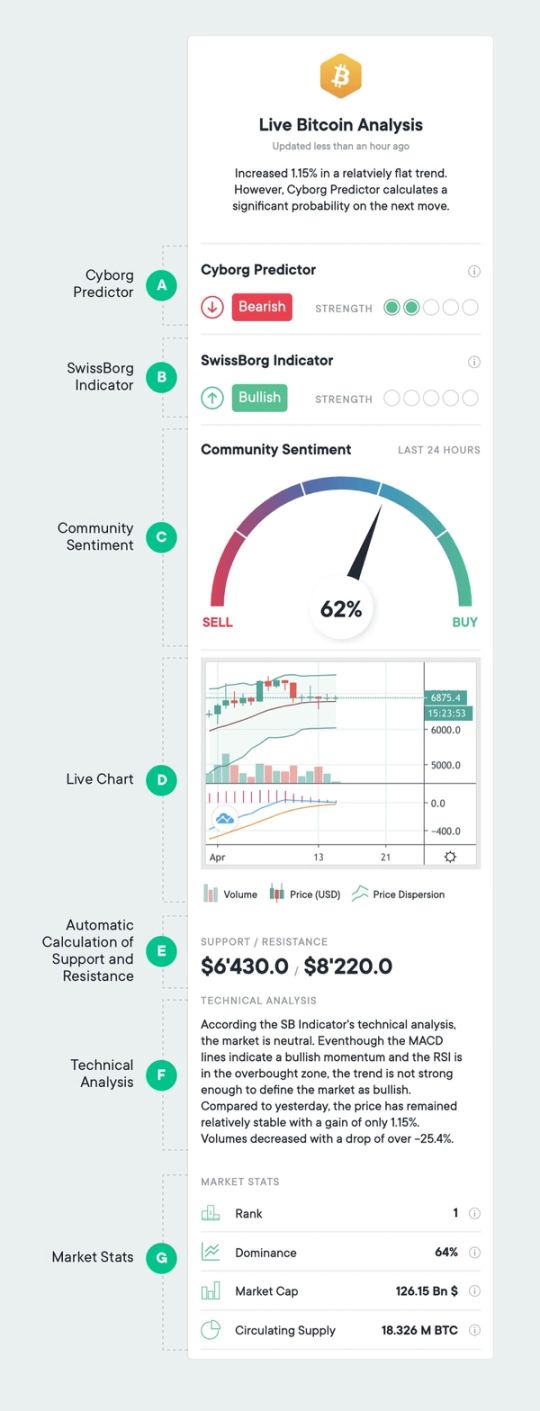
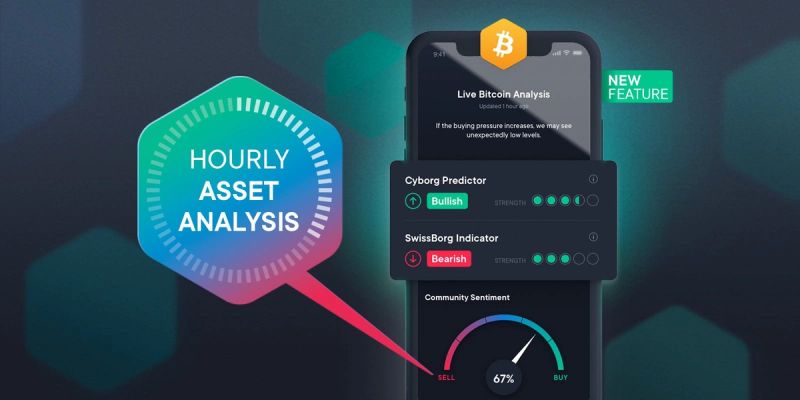
The Cyborg Predictor (prediction for the next 24 hours)
The Cyborg Predictor, which has beaten over 95% of players on the Community app in predicting the price of Bitcoin, is updated hourly and deployed across all SwissBorg app tokens. It predicts the market movement for the next 24 hours: Bullish (Up) or Bearish (Down).
This Machine Learning algorithm interprets historical market data and combines technical indicators for you in a systematic way. In other words, it combines an amount of information that is impossible for a human to take into account to give you a short-term prediction. As an extra, you will discover the Cyborg Predictor's strength. The greater strength, the more confident the Cyborg Predictor is for the next 24 hours.
The SwissBorg Indicator (Current Trend)
The SwissBorg Indicator gives you the current state of the market trend in one single indicator! Indeed, there are several types of indicators that allow you to have different views of the market. For example, you can find oscillators, momentary indicators, trends and others.
It is difficult to form an opinion from all the information available. To be able to do this, we have combined, in a weighted way, the most relevant technical indicators to create a single indicator that gives you direct information on the state of the market.
This single indicator consists of the following indicators (see glossary below):
a. The RSI (14)
b. MACD lines
c. The Bollinger Bands
d. The trend over the last 10 days
As for the CyBorg Predictor, this one single indicator features different levels of strength. In other words, it indicates how bullish or bearish the market is at the moment: the more strength the Cyborg Predictor has, the more bullish the market.
The Community Sentiment (in the Last 24 hours)
In addition to a prediction for the next 24 hours and the current market trend, you will find the sentiment of the community in this analysis. This indicator is based on the volume of transactions on the SwissBorg app over the last 24 hours that reveals the balance between the buying and selling pressure. An indicator close to 0% points to a bearish sentiment, an indicator close to 100% signals a massive buy, while 50% indicates a neutral sentiment.
A live chart with technical indicators
On this chart, you will find the daily candle of the live USD price. There are additional indicators if you need more information for your decision making: the price dispersion (Bollinger Band), the 20-day moving average and the MACD lines that give you a reading of the current market momentum.
Automatic Calculation of Support and Resistances
Levels of support and resistance are critical levels to monitor and are not always obvious to identify. That is why we wanted to provide this information automatically for our community members! To save you time, we analyse volume profiles over the last few months to identify the first levels of support and resistance for free.
Automatically generated Technical Analysis
Based on all the market information available to us, we generate a technical analysis that is updated hourly. It takes into account information from the Cyborg Predictor, all the technical indicators that we consider, as well as price and volume variations.
In a few words, you will find a summary of the market situation.
Market Stats
In this section, you will find additional statistics for each token available in the SwissBorg app such as:
- The Rank calculated by CoinMarketCap based on the market capitalisation of the token or coin.
- The Dominance or, in other words, the importance of the market capitalisation of the project in relation to the market as a whole.
- The Market Capitalisation which is defined as the price times the number of tokens in circulation.
- The Circulating Supply which is simply the number of tokens or coins that are publicly available and circulating in the market.
And much more...
The Hourly Asset Analysis is continually optimised. Algorithms are reviewed frequently to optimise their use and new information will be added to satisfy the needs of our community.
Glossary
Bullish: The term "bull" or "bullish" comes from the bull, who strikes upwards with its horns, thus pushing prices higher. Being ‘bullish’ represents an opinion/belief that the price will rise. A bull market is when an asset's price is rising over a sustained time period.
Bearish: The term "bear" or "bearish" comes from the bear, who strikes downward with its paws, thus pushing prices down. Being ‘bearish’ represents an opinion/belief that the price will fall. A bear market is when an asset's price is falling over a sustained period of time.
Moving Average (MA): Trend-following indicator derived from the simple average of the prices on a given time period (for example 20 days).
Volatility: Degree of variation (or dispersion) of the price over time. A period with a lot of price variation will show higher volatility than a stable market that has small price variation.
RSI: The RSI (Relative Strength Index) measures the magnitude and the velocity of price movements. It is deduced from the ratio between positive and negative price changes in a given period of time. This momentum oscillator, measured on a scale from 0 to 100, indicates if the asset is overbought or oversold (usually, an RSI > 70% will indicate an overbought period while an RSI < 30% will indicate an oversold period).
Support/Resistance: Levels where the prices will tend to stop and could probably reverse their trend. A support level will likely tend to stop the prices dropping while resistance is a level where the selling pressure is higher and will likely stop the price rising. Once a support or resistance level is reached, the price will bounce back or breakthrough the level and continue its actual trend.
MACD: The Moving Average Convergence Divergence is a trend following momentum indicator that compares a short period and a longer period’s moving average. From these comparisons, a “signal line” and a “MACD” line are constructed. Multiple information can be extracted from this indicator. In particular, when the “Signal” and the “MACD” are crossing, this indicates a probable momentum change between “bulls” and “bears”.
Bollinger Bands (BB): Bollinger Bands illustrate the dispersion of prices around the average. Bollinger Bands are composed of an upper and a lower band. Usually, the price oscillates between these two bands. When volatility increases, these bands move apart as they contract during a phase of low volatility. In terms of technical analysis, we can read the graph as follows: if the price is close to one of these bands, we are far from the average and it is likely that we are overbought or oversold. In other words, it is likely that the trend will change direction in the short term.
Disclaimer
The information provided in the Asset Analysis is intended for general guidance and information purposes only. The contents of the Asset Analysis are under no circumstances intended to be considered as investment, business, legal or tax advice. SwissBorg does not accept any responsibility for individual decisions made based on the Asset Analysis and strongly encourages you to do your own analysis based on your own personal circumstances. Although best efforts are made to ensure that all information provided herein is accurate and up to date omissions, errors or mistakes may occur. Copyright SwissBorg Solutions OÜ and related entities © 2020, All rights reserved.
Deep dive into the Hourly Asset Analysis