For the sake of transparency towards our community, on a monthly basis we aggregate our data to give you a report on the key figures related to SwissBorg’s Smart Yield wallets.
The content of this report will be subject to change based on your feedback and the evolution of the information we receive. The report has been cleared of overwhelming graphs and a new table has replaced them.

The Smart Yield wallet simplifies and optimises earning a yield on your crypto, every single day. The goal is to find the best return for the lowest risk, while offering some of the best yielding conditions available in the market. Learn more about how Smart Yield works.
The DeFi landscape
April saw bearish price action in the crypto and traditional markets due to continued geopolitical concerns and record high inflation. We typically do not comment on traditional markets, but recent correlation between crypto and stocks have reached all time highs, and this analysis would be incomplete without considering macroeconomic factors. One of the correlations we’ve previously highlighted (and still see playing out) is the inverse relationship between price action and TVL in DeFi: price goes up, number of ETH deposited in DeFi goes down and vice versa. Appreciating prices can mean ‘risk-on’ in a limited context, where investors are more likely to take speculative positions as opposed to holding and yielding ETH (and other L1 assets). Correlation between crypto and traditional markets is a recent phenomenon, with generally higher correlation since 2020 (most pronounced during the March 2020 crash). We propose this is due to increasing adoption from traditional institutions, where crypto is seen as a risk-on asset and subsequently disposed of during times of uncertainty. DeFi has largely remained untouched by traditional institutions due to lack of expertise in the field as well as regulatory concerns. If this barrier to entry is overcome, we may see large inflows to DeFi, but also large outflows during bearish periods, and subsequently nullify the inverse relationship observed thus far. Network congestion on volatile price action days first comes to mind, and we hope that existing blockchains have addressed their scalability issues by then.
On the topic of scalability, Optimism (a layer 2 solution on Ethereum) announced an airdrop for early users. Several criteria were outlined, with increased usage being rewarded with larger airdrop allocations. It’s worth noting that many of the layer 2 solutions have yet to announce a token, and given how the networks are structured, the requirement of a native layer 2 token is almost implied. There are several such chains, with Arbitrum hinting at an airdrop some time this summer. We have already seen ‘airdrop season’ towards the beginning of 2021, and there could be another layer 2 flavored one this summer.
On the security front, April continued to see large exploits with the most profitable hack amounting to $180 million (Beanstalk, a credit based stablecoin protocol). The mechanism was slightly different to previous exploits, where a malicious governance proposal was pushed through to keep platform funds. The equivalent would be to borrow from a bank, use the borrowed funds to buy out the bank, then forgive their own debt. This sounds absurd but highlights the need for careful protocol mechanism design when translating traditional financial systems to DeFi. Another interesting exploit this month was the one conducted on Inverse Finance as it required careful planning on price oracle manipulation as well as awareness of MEV (miner extractable value). The classic flash loan with price oracle manipulation attack vector is much less common now as developers put in place safeguards, one of which is the use of time-weighted average prices. However, this still requires careful design. One of the assumptions that some developers take for granted is exploiters always using flash loans as a source of capital. However, we’ve seen several billions of dollars in exploits over the past couple of years, and it is likely no longer the case that exploiters do not already possess large amounts of capital for attacks. This opens additional attack vectors as it is now possible to plan protocol breaches over several transactions or even blocks, and this is what we see with Inverse Finance. Though it may seem like exploits have become almost ‘normal’ and expected, their nature continually increases in creativity complexity, and it is safe to assume this will continue for some time.
Smart Yield wallets analysis
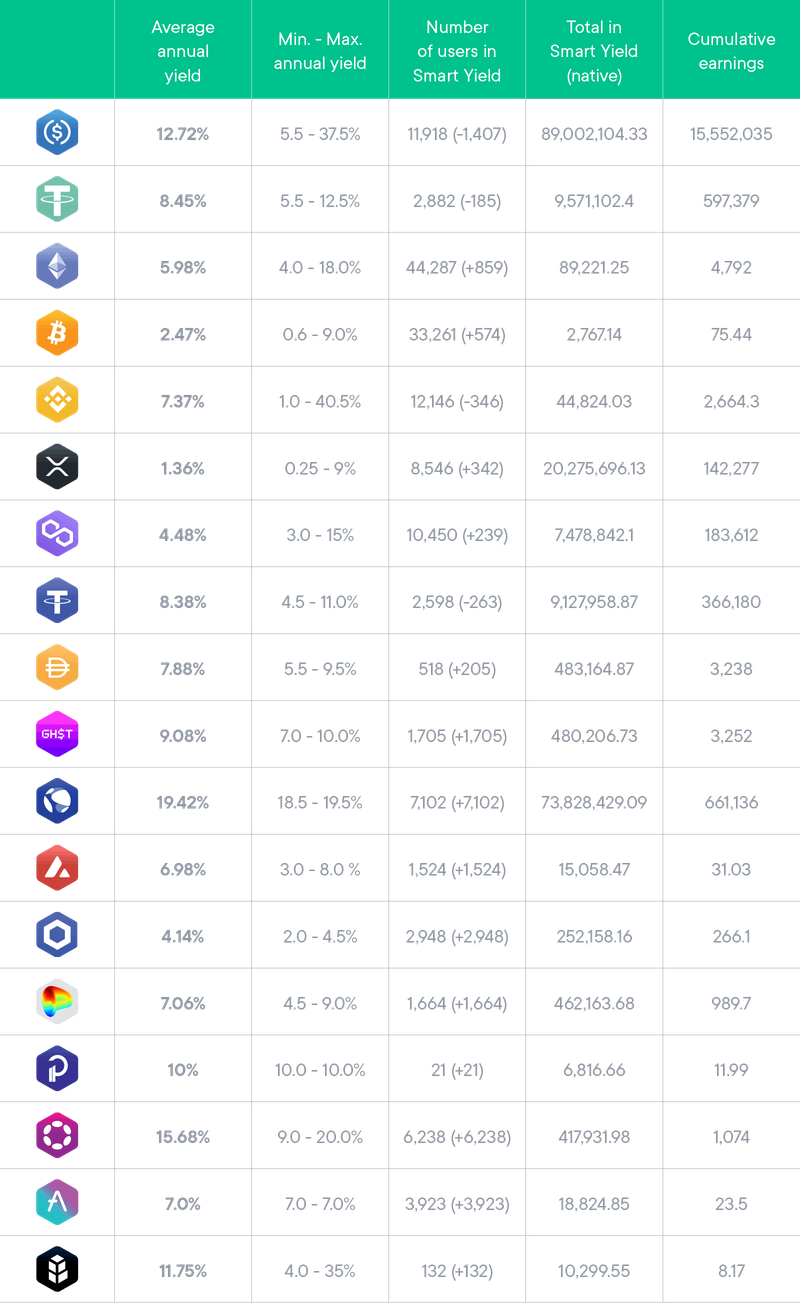
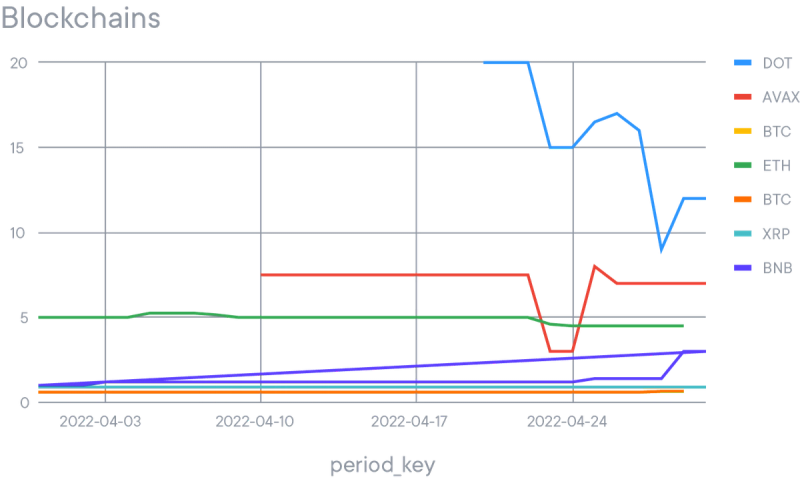
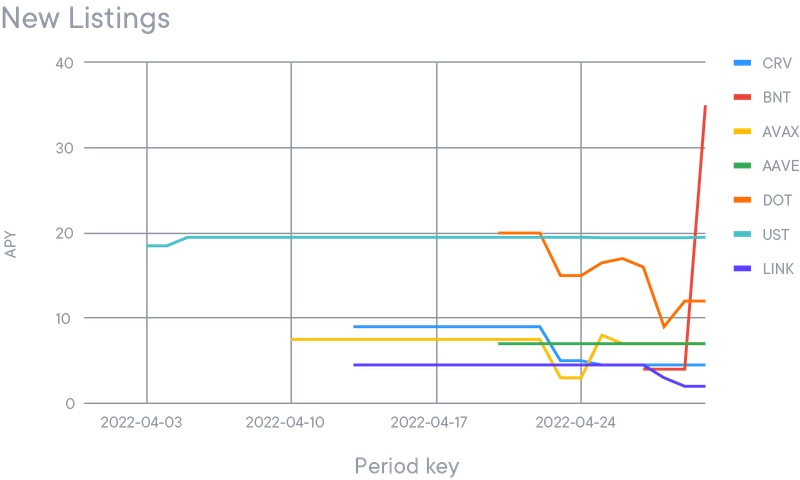
The following table summarizes the various statistics for the yield wallet and history and value at the end of April. Very exciting month, 7 new wallets were added and brought a substantial number of new users. Including two new main coins, AVAX and DOT, the last one which offered very competitive yield due to lack of liquidity on Venus. It also creates a flow of AuM from other stable coins to UST, which sits on the first place of the APY podium. It led to a strong reduction in the total amount in USDc particularly.
PAR, a Euro stable coins competitor which joins the game and allow to improve the APY thanks to Mimo protocol. BNT is also a strong contender as the V3 releases gets closer and promises high APY for BNT holders as well as simplification of the process.


Strategy optimiser
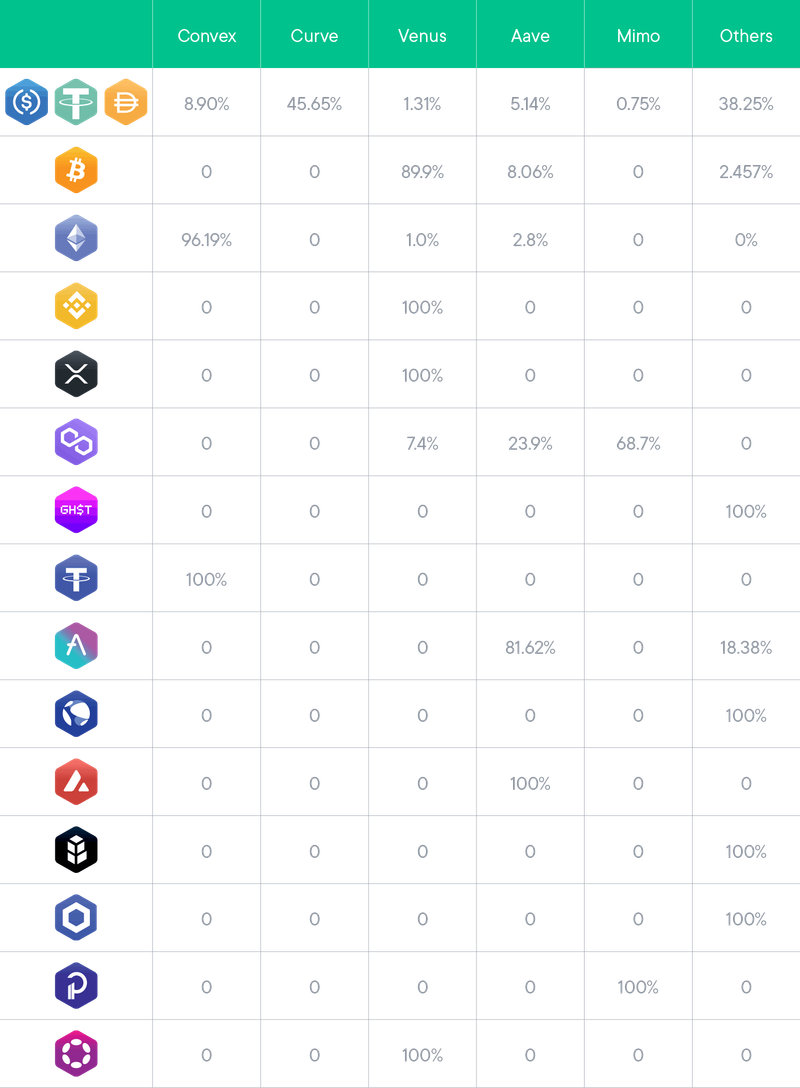
The strategy optimiser continues to allocate funds exclusively to blue-chip projects. These are:
- Aave
- Compound
- Curve/Convex
- InstaDapp
- Venus
- PancakeSwap
- Beefy
- Mimo
- GotchiVault
- Anchor
- Bancor
We recall that the following selection of protocols always focuses on the less risky strategies out there and therefore may impact the final APY. Furthermore, the optimiser only keeps exposure to the underlying asset of the strategy and never spreads it across different assets.


